Jul 25, 2011
Regression analysis


Jul 23, 2011
Polynomial Fitting- Least Squares
Kindly acknowledge the above source and not this blog. The material has been presented here to serve as learning material for my students. No commercial activity is involved.
Generalizing from a straight line (i.e., first degree polynomial) to a
 th degree polynomial
 |
(1)
|
![R^2=sum_(i=1)^n[y_i-(a_0+a_1x_i+...+a_kx_i^k)]^2.](https://mathworld.wolfram.com/images/equations/LeastSquaresFittingPolynomial/NumberedEquation2.gif) |
(2)
|
 |  | ![-2sum_(i=1)^(n)[y-(a_0+a_1x+...+a_kx^k)]=0](https://mathworld.wolfram.com/images/equations/LeastSquaresFittingPolynomial/Inline4.gif) |
(3)
|
 |  | ![-2sum_(i=1)^(n)[y-(a_0+a_1x+...+a_kx^k)]x=0](https://mathworld.wolfram.com/images/equations/LeastSquaresFittingPolynomial/Inline7.gif) |
(4)
|
 |  | ![-2sum_(i=1)^(n)[y-(a_0+a_1x+...+a_kx^k)]x^k=0.](https://mathworld.wolfram.com/images/equations/LeastSquaresFittingPolynomial/Inline10.gif) |
(5)
|
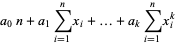 |  |  |
(6)
|
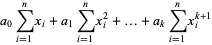 |  |  |
(7)
|
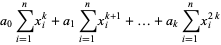 |  |  |
(8)
|
![[n sum_(i=1)^(n)x_i ... sum_(i=1)^(n)x_i^k; sum_(i=1)^(n)x_i sum_(i=1)^(n)x_i^2 ... sum_(i=1)^(n)x_i^(k+1); | | ... |; sum_(i=1)^(n)x_i^k sum_(i=1)^(n)x_i^(k+1) ... sum_(i=1)^(n)x_i^(2k)][a_0; a_1; |; a_k]=[sum_(i=1)^(n)y_i; sum_(i=1)^(n)x_iy_i; |; sum_(i=1)^(n)x_i^ky_i].](https://mathworld.wolfram.com/images/equations/LeastSquaresFittingPolynomial/NumberedEquation3.gif) |
(9)
|
![[1 x_1 ... x_1^k; 1 x_2 ... x_2^k; | | ... |; 1 x_n ... x_n^k][a_0; a_1; |; a_k]=[y_1; y_2; |; y_n].](https://mathworld.wolfram.com/images/equations/LeastSquaresFittingPolynomial/NumberedEquation4.gif) |
(10)
|
![[1 1 ... 1; x_1 x_2 ... x_n; | | ... |; x_1^k x_2^k ... x_n^k][1 x_1 ... x_1^k; 1 x_2 ... x_2^k; | | ... |; 1 x_n ... x_n^k][a_0; a_1; |; a_k] =[1 1 ... 1; x_1 x_2 ... x_n; | | ... |; x_1^k x_2^k ... x_n^k][y_1; y_2; |; y_n],](https://mathworld.wolfram.com/images/equations/LeastSquaresFittingPolynomial/NumberedEquation5.gif) |
(11)
|
![[n sum_(i=1)^(n)x_i ... sum_(i=1)^(n)x_i^k; sum_(i=1)^(n)x_i sum_(i=1)^(n)x_i^2 ... sum_(i=1)^(n)x_i^(k+1); | | ... |; sum_(i=1)^(n)x_i^k sum_(i=1)^(n)x_i^(k+1) ... sum_(i=1)^(n)x_i^(2k)][a_0; a_1; |; a_k]=[sum_(i=1)^(n)y_i; sum_(i=1)^(n)x_iy_i; |; sum_(i=1)^(n)x_i^ky_i].](https://mathworld.wolfram.com/images/equations/LeastSquaresFittingPolynomial/NumberedEquation6.gif) |
(12)
|
 points
  and fitting with
  , ...,
  gives
gives ![[y_1; y_2; |; y_n]=[1 x_1 x_1^2 ... x_1^k; 1 x_2 x_2^2 ... x_2^k; | | | ... |; 1 x_n x_n^2 ... x_n^k][a_0; a_1; |; a_k],](https://mathworld.wolfram.com/images/equations/LeastSquaresFittingPolynomial/NumberedEquation7.gif) |
(13)
|
 |
(14)
|
 ,
,  |
(15)
|
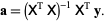 |
(16)
|
 in the above equations reproduces the linear solution.
 Apr 6, 2011
R-squared measure
R2 can be a lousy measure of goodness-of-fit, especially when it is misused. The Akaike Information Criterion (AIC) affords some protection by penalizing attempts at over-fitting a model, but understanding what R2 is, and what it's limitations are, will keep you from doing something dumb.
By definition, R2 is the fraction of the total squared error that is explained by the model. Thus values approaching one are desirable. But some data contain irreducible error, and no amount of modeling can improve on the limiting value of R2. Sadly, many practitioners, including some who should know better, pursue very high order polynomial models in the mistaken but widely held belief that as the number of parameters approaches the number of observations, the model can be made to pass through every point. (It appears that the origin of this misconception is, as with many difficulties with applied statistics, not reading the fine print.)
Here is an example. The data are real. Repeated testing under nominally identical conditions results in considerable variability in measured material strength. These specimen-to-specimen differences are real and result from uncontrollable, and sometimes immeasurable, deviations in material characteristics such as chemistry, microstructure, processing, or fabrication. (It is a common oversight to suppose that all of the variables you can measure includes all that have an influence.)
Thus, it is fruitless trying to "explain" this random variability in material response using increasingly involved functions of test temperature, since temperature can only account for the central behavior, and not deviations from it.

One alarming consequence of choosing the "best" model because it has an incrementally higher R2, is how poorly it can be expected to behave when used to predict behavior at conditions for which there are no data, like 150F in this example.
While the lesson seems obvious in this example, the problem can appear in any collection of observations containing a large random component. Thus, one of the early steps in model building should be to determine how much of the observed variability is irreducibly random*.
* Furthermore, in some situations the random error may exhibit autocorrelation in time and/or space. This necessitates more sophisticated modeling since most common statistical regression packages require the errors to be uncorrelated (and normal).
Mar 11, 2011
identifying trend in stock markets
Here is a full list of the criteria we require for a data series to be formally identified as an uptrend:
• The actual value must lead the 25-day moving average;
• the 25-day moving average must lead the 65-day moving average;
• the 25-day moving average must have been rising for at least 5 days;
• the 65-day moving average must have been rising for at least 1 day;
• to filter out passive uptrends, the data must show a rise of at least 2.5% on the month.
The analytical criteria for a downtrend are exactly the converse of the above criteria.
Feb 5, 2011
The Capital Asset Pricing Model

Taken from http://www.investopedia.com/articles/06/CAPM.asp .. Kindly acknowledge the original source and not me.
No matter how much we diversify our investments, it's impossible to get rid of all the risk. As investors, we deserve a rate of return that compensates us for taking on risk. The capital asset pricing model (CAPM) helps us to calculate investment risk and what return on investment we should expect. Here we look at the formula behind the model, the evidence for and against the accuracy of CAPM, and what CAPM means to the average investor.
Birth of a Model
The capital asset pricing model was the work of financial economist (and, later, Nobel laureate in economics) William Sharpe, set out in his 1970 book "Portfolio Theory And Capital Markets." His model starts with the idea that individual investment contains two types of risk:
1. Systematic Risk - These are market risks that cannot be diversified away. Interest rates, recessions and wars are examples of systematic risks.
2. Unsystematic Risk - Also known as "specific risk," this risk is specific to individual stocks and can be diversified away as the investor increases the number of stocks in his or her portfolio. In more technical terms, it represents the component of a stock's return that is not correlated with general market moves.
Modern portfolio theory shows that specific risk can be removed through diversification. The trouble is that diversification still doesn't solve the problem of systematic risk; even a portfolio of all the shares in the stock market can't eliminate that risk. Therefore, when calculating a deserved return, systematic risk is what plagues investors most. CAPM, therefore, evolved as a way to measure this systematic risk.
The Formula
Sharpe found that the return on an individual stock, or a portfolio of stocks, should equal its cost of capital. The standard formula remains the CAPM, which describes the relationship between risk and expected return.
Here is the formula:

CAPM's starting point is the risk-free rate - typically a 10-year government bond yield. To this is added a premium that equity investors demand to compensate them for the extra risk they accept. This equity market premium consists of the expected return from the market as a whole less the risk-free rate of return. The equity risk premium is multiplied by a coefficient that Sharpe called "beta."
Beta
According to CAPM, beta is the only relevant measure of a stock's risk. It measures a stock's relative volatility - that is, it shows how much the price of a particular stock jumps up and down compared with how much the stock market as a whole jumps up and down. If a share price moves exactly in line with the market, then the stock's beta is 1. A stock with a beta of 1.5 would rise by 15% if the market rose by 10%, and fall by 15% if the market fell by 10%. (For further reading, see Beta: Gauging Price Fluctuations and Beta: Know The Risk.)
Beta is found by statistical analysis of individual, daily share price returns, in comparison with the market's daily returns over precisely the same period. In their classic 1972 study titled "The Capital Asset Pricing Model: Some Empirical Tests," financial economists Fischer Black, Michael C. Jensen and Myron Scholes confirmed a linear relationship between the financial returns of stock portfolios and their betas. They studied the price movements of the stocks on the New York Stock Exchange between 1931 and 1965.
Beta, compared with the equity risk premium, shows the amount of compensation equity investors need for taking on additional risk. If the stock's beta is 2.0, the risk-free rate is 3% and the market rate of return is 7%, the market's excess return is 4% (7% - 3%). Accordingly, the stock's excess return is 8% (2 X 4%, multiplying market return by the beta), and the stock's total required return is 11% (8% + 3%, the stock's excess return plus the risk-free rate).
What this shows is that a riskier investment should earn a premium over the risk-free rate - the amount over the risk-free rate is calculated by the equity market premium multiplied by its beta. In other words, it's possible, by knowing the individual parts of the CAPM, to gauge whether or not the current price of a stock is consistent with its likely return - that is, whether or not the investment is a bargain or too expensive.
What CAPM Means for You
This model presents a very simple theory that delivers a simple result. The theory says that the only reason an investor should earn more, on average, by investing in one stock rather than another is that one stock is riskier. Not surprisingly, the model has come to dominate modern financial theory. But does it really work?
It's not entirely clear. The big sticking point is beta. When professors Eugene Fama and Kenneth French looked at share returns on the New York Stock Exchange, the American Stock Exchange and Nasdaq between 1963 and 1990, they found that differences in betas over that lengthy period did not explain the performance of different stocks. The linear relationship between beta and individual stock returns also breaks down over shorter periods of time. These findings seem to suggest that CAPM may be wrong.

While some studies raise doubts about CAPM's validity, the model is still widely used in the investment community. Although it is difficult to predict from beta how individual stocks might react to particular movements, investors can probably safely deduce that a portfolio of high-beta stocks will move more than the market in either direction, and a portfolio of low-beta stocks will move less than the market.
This is important for investors - especially fund managers - because they may be unwilling to or prevented from holding cash if they feel that the market is likely to fall. If so, they can hold low-beta stocks instead. Investors can tailor a portfolio to their specific risk-return requirements, aiming to hold securities with betas in excess of 1 while the market is rising, and securities with betas of less than 1 when the market is falling.
Not surprisingly, CAPM contributed to the rise in use of indexing - assembling a portfolio of shares to mimic a particular market - by risk averse investors. This is largely due to CAPM's message that it is only possible to earn higher returns than those of the market as a whole by taking on higher risk (beta). (To learn more, see The Lowdown On Index Funds.)
Conclusion
The capital asset pricing model is by no means a perfect theory. But the spirit of CAPM is correct. It provides a usable measure of risk that helps investors determine what return they deserve for putting their money at risk. To learn more, see Achieving Better Returns In Your Portfolio.
Jan 17, 2011
Technical indicators-II
1. Chaikins oscillators
2. RSI
3. Bollinger bands
4. OBV
other volume based indicators
Jan 11, 2011
Futures and options Introduction
Futures and Options (F&O) is a famous phrase used by TV channels, web sites and in conversation nowadays but many of you many not familiar with the concept. Let me try and explain, in very simple terms.
Firstly, let me confirm what you already know: That you can buy and sell stocks on an exchange, and prices of stocks vary every day, and perhaps every minute. You buy a stock hoping for future appreciation, and sell when you want to exit or book profits.
This is called the "cash" or the "spot" market - that means, when you say "I will buy 100 shares of company X at Rs. 152" on a stock exchange, someone can sell it to you and you will get the shares "on the spot". (Technically, you'll get delivery after two days but that is really an administrative lag) You also pay money "on the spot" - that is, you will need to immediately pay the Rs. 15,200 in the example above.
Futures
Now, let me talk about the futures markets. A future is a derivative contract in which two parties agree to buy or sell something to each other on a particular price at a FUTURE date.
That means delivery is not immediate, it is at a much later date. And payment is also not immediate, it is at a later date. This kind of contract is also called a "forward contract".
Why do people do this? And how is this different from buying today?
No delivery right now
Futures are for different kinds of requirements. For instance you may not have the money right now to buy, but you believe the price will go up. You just buy a forward contract for a later date, and on that date you buy and IMMEDIATELY sell, so that you will simply pocket the difference (or lose the difference if the stock has lost money).
Short Selling
Secondly, futures can be used to "short sell". If you want to sell something you should own it first, no? But futures are different - since they are for a later date, you can sell something without owning it, and then buy it later! So if you believe the price of an item is going down, you can SELL a forward contract. Since you don't have to deliver it right now, the buyer does not care if you already have it or not. On the later date, just buy from the market and give it to the buyer, pocketing (or losing) the difference.
Hedging
Futures are also for "hedging". Let's say you are a rice farmer and have 1000 kilos of rice growing in your farm. You can harvest it only three months later but right now the price is very good, nearly Rs. 20 per kilo. But you know that this year, the rains have been kind, so every rice farmer is going to get a good crop. So there will be too much rice in the market, and prices will come down, even as low as Rs. 12 per kilo! What can you do?
You can't sell the rice right now, because then the buyer will say "show me the rice" and you can't show him because you can't harvest it until three more months. But if you don't sell right now you will lose Rs.8 per kg!
What you can do is SELL a futures contract for 1000 kilos at today's price for three months later, Rs. 20 per kilo. Then three months later when you harvest if the price has gone down to Rs. 12 per kilo, you sell it in the market for Rs. 12 per kilo and make Rs. 12,000. Then you also have to sell 1000 kilos in your forward contract at Rs. 20, but for that you simply buy from the market at Rs. 12 and give it to the buyer at Rs. 20, making the extra Rs.8 per kilo, totally Rs.8000. Meaning you have made Rs. 20,000 for your 1000 kilos!
You may be thinking: Why doesn't he simply give the 1000 kilos from his farm to the buyer? Well, the buyer may be in Brazil! Market traders for commodities like Rice can be anywhere in the world, therefore when you enter into a futures contract on an exchange, you need not terminate it with delivery. (in India, in most cases, you can't even if you want to). You buy and sell on the very same exchange on the "SPOT" price on the date of delivery. Meaning, if you SOLD a futures contract, then on the future date the exchange will assume that you will buy at market price (spot price) and give you the difference between your future contract price (selling price) and the spot price (buying price).
The Underlying
In the example above, what was bought/sold in the future was "RICE". This is the "underlying" commodity being traded in the futures contract. Rice is also traded in the "spot" market - which can be your local kirana store, or a wholesale APMC yard or a commodity exchange (meaning, you pay and you get your goods right now). The "underlying" can be anything - a commodity like rice, a set of company shares, an index value, foreign currency etc.
Exchanges
Okay what if I tell you that I will buy rice at Rs.20 and the price falls to Rs. 12? I can then run away and hide in a corner, and break my promise, because I stand to lose Rs. 8. This is where exchanges come in.
Exchanges ensure that your contract is executed. They "assure" your contract. So if I run away, the exchange will still make sure you get your profits. They will chase me for the losses. (In fact a futures contract must be traded on the exchange. If it's not, then it's just a "forward" contract)
Contract Values and Margin In order to make sure that I don't run away from them, exchanges ask for a "margin" - a certain portion of the contract value as a "deposit" until the contracted date. In India this is between 12 to 50% of the contract value for shares; so if you buy a future for buying 100 Infosys shares at Rs. 2200, the contract value is Rs. 220,000. The margin can be 20% (dictated by your broker or the exchange) so the margin will be Rs. 44,000. You are required to pay the margin on the day you buy or sell the futures contract. On the contracted date (in the future), you will get back your margin plus your profit (or minus your loss).
Mark to market
Let us assume I bought a forward contract (100 shares of INFY at current future price of Rs. 2200 per share, on January 27, 2007) paying a margin of Rs. 44,000. Now suddenly if there is a crash and the price of INFY in the spot market dipped to Rs. 1700? Essentially I have lost Rs. 500 per share - which, for 100 shares, is Rs. 50,000! This is greater than my margin of Rs. 44,000 so the broker or exchange may still think I can run away and they will be left to cover the loss. So they can make a "Marked to market" margin call, meaning that they will ask me to provide the extra Rs. 6,000 as an additional margin (and maybe another 20,000 to cover a FURTHER fall in prices, that they can do).
Usually mark-to-market means the difference between the spot price and the agreed future price - this can be positive ("Mark-to-market profit") or negative ("MTM Loss"). Futures are actively traded in the market, and the price of the future is not decided by you - so once you have bought the future, you can SELL the contract to someone else. Let's say the the contract I bought at Rs. 2,200 is now trading at Rs. 2,300 instead. I can sell the contract itself, and I make the Rs. 100 as profit per share - for 100 shares, it's a Rs. 10,000 profit. The exchange will also give me my margin back, and take a margin from the new owner of the contract.
Square off
On the agreed date of the contract, the exchange will "square off" all contracts. Meaning, all buyers and sellers will be paid back their margin including any marked to market profits or minus any losses as of that date. To avoid arbitrary dates, stock exchanges in India have only three open (purchaseable) future contract dates - the last thursday of the current month, the last thursday of next month and the last thursday of the month after that. These are called near month, month+1, month+2. The square off happens at the end of that Thursday.
Options
Futures are pre-agreed contracts and the buyer MUST sell and the seller MUST purchase. They have no choice in the matter at all, once they sign the contract the contract has to be marked to market every day, they have to pay the margin and they have to square off. That means both the buyer and the seller has an OBLIGATION to square off the deal.
Now futures dealers are also quite smart - they want to make profits but they want to reduce their losses. So there is a concept of "options" - a kind of derivative contract which is slightly different.
The buyer of an Option has the RIGHT, but not the obligation to exercise the contract. What does this mean? Let's say I think the Infosys share will go up next month, but I am not sure.
Instead of buying a future, I can buy a "CALL" option, which is a "right to buy" at a later date. If on that date the contract is favourable to me (meaning the spot price of INFY is higher) I will purchase it and square off, resulting in a profit to me.
If the spot price is lower than my call option price, I will "ditch" the contract, and not exercise it...meaning I have no losses.
But then the person selling it to me must be really stupid. Because if the price is higher, he has the OBLIGATION to sell it to me and make a loss, but if the price is lower I don't exercise the option and he does not make a profit. So why would he do it? He charges me a "premium" which is the amount I pay to buy the option. It may be very cheap; about Rs. 20 per share, but that is the money for his trouble that he gets to keep in case I decide not to exercise the option. If I decide to exercise, he still keeps the margin, but pays the mark-to-market loss.
Calls and puts
The right to BUY an underlying stock at a certain price is known as a call option. The right to SELL an underlying stock at a certain prices is a PUT option.
It is quite confusing. You can buy a call option, and you can buy a put option. You have to associate the phrase "call" with "right to buy" and "put" with "right to sell". (If you are really confused, repeat this mantra 108 times:
CALL is the right to purchase)
PUT is the right to sell
Strike price
Now futures are traded like shares - so the price of the future is readily available in the market, and goes up and down every day. But an option is slightly different, because it is a right and not an obligation. You buy a future in the futures market, based on who is willing to pay how much for a future.
But an option is always at a pre-agreed price. In stock exchanges for stocks and indices, the exchange allows different strike prices, usually Rs. 10 between each other, and a new list of tradeable strike prices is released everyday. These will usually be a few priecs above the current market price, and a few prices below.
Example: If Infosys is trading at Rs. 2172 today, the exchange may allow strike prices of Rs. 2150, 2160, 2170, 2180, 2190 and 2200. If the price goes up to 2200 the exchange may open up NEW strike prices of 2210, 2220 and 2230 (the other ones are still available of course).
Writers
If you buy a CALL option then you buy the right to purchase something. But who sells it to you? This other person does not have the RIGHT to sell it to you, she has the OBLIGATION of selling it to you if you want it. This person is called a writer. You can buy an option, but you can also WRITE an option (meaning you are now obligated to sell it).
If you write an option you will receive the premium that the buyer will pay. (Minus any brokerage and taxes).
Writers have a problem: They have limited profits (the margin they receive, when the strike price is not profitable for the buyer) but unlimited risk of loss when the strike price is profitable. That means for a call option, if the spot price is below the strike price, the buyer will not exercise the option, therefore you only get the premium. If the spot price is above, buyer will exercise and you pay the difference (but keep the margin).
Let's say you buy a CALL option of 100 INFY shares from me (Rs. 2200 strike price, Jan 07, Rs.20 premium per share). You pay me Rs. 2000 (Rs. 20 x 100 shares) as premium. If the price goes to Rs. 2,300 you will exercise the option and I will have to pay the Rs. 100 difference per share, totally Rs. 10,000. My loss is Rs. 8,000 because I got the 2,000 premium.
If the price goes down to Rs. 2,100, you will not exercise the option, and I will get only Rs. 2,000, which was the premium.
Why do I write options? Because most options go unexercised! Meaning, I can write an option today and it is quite likely that the market price will not be within the premium so I won't have to lose money! And after all, I can write a CALL option and BUY a future at the same time, ensuring that I make profits in the difference. (This is also hedging)
In the money, out of the money
If a call option strike price is below the spot price, it is "in the money". Meaning, if INFY price is Rs. 2200 and I have bought a call option for Rs. 2100, I am making profits, so the option is "in the money".
The reverse is "out of the money" or "OTM". Meaning, if I buy a call option for a strike price of 2100 but the current price is Rs. 2000, then I am not making profits right now, so the option is OTM. Writers usually like to make OTM contracts so that they are not immediately exposed to loss. (In the money options usually trade for a big premium, so big that when you consider the premium, you are making losses!)
Jan 10, 2011
Sensex-Beta
| Beta, R2, Volatility and Returns of SENSEX Scrips for One Year Period |
| Scrip code | Company | Beta Values | Co-efficient of Determination (R2) | Avg. Daily Volatility (%) | Returns (1 year) (%) | Weightage (%) in SENSEX as on 30/11/10 | Free-float Adj.Factor as on 30/11/10 |
| 500410 | ACC LTD. | 0.66 | 0.18 | 1.57 | 23.96 | 0.66 | 0.55 |
| 500103 | BHARAT HEAVY ELECTRICALS LTD. | 0.79 | 0.41 | 1.27 | -1.73 | 2.45 | 0.35 |
| 532454 | BHARTI AIRTEL LTD. | 0.77 | 0.13 | 2.14 | 20.25 | 3.11 | 0.35 |
| 500087 | CIPLA LTD. | 0.44 | 0.08 | 1.56 | 7.36 | 1.16 | 0.65 |
| 532868 | DLF Ltd. | 1.56 | 0.49 | 2.27 | -12.61 | 0.85 | 0.25 |
| 500180 | HDFC BANK LTD | 0.86 | 0.41 | 1.36 | 29.15 | 5.51 | 0.80 |
| 500182 | HERO HONDA MOTORS LTD | 0.50 | 0.11 | 1.57 | 14.67 | 1.28 | 0.50 |
| 500440 | HINDALCO INDUSTRIES LTD | 1.83 | 0.56 | 2.48 | 49.26 | 1.80 | 0.70 |
| 500696 | HINDUSTAN UNILEVER LTD. | 0.49 | 0.12 | 1.44 | 4.79 | 2.12 | 0.50 |
| 500010 | HOUSING DEVELOPMENT FIN. CORPN. LTD | 1.05 | 0.47 | 1.55 | 24.74 | 5.87 | 0.90 |
| 532174 | ICICI BANK LTD. | 1.47 | 0.62 | 1.90 | 32.32 | 8.52 | 1.00 |
| 500209 | INFOSYS TECHNOLOGIES LTD. | 0.79 | 0.38 | 1.30 | 27.92 | 9.66 | 0.85 |
| 500875 | ITC LTD. | 0.66 | 0.23 | 1.40 | 32.66 | 5.98 | 0.70 |
| 532532 | JAIPRAKASH ASSOCIATES LIMITED | 1.58 | 0.48 | 2.32 | -26.64 | 0.84 | 0.55 |
| 532286 | JINDAL STEEL & POWERS LTD. | 1.04 | 0.40 | 1.66 | -7.26 | 1.74 | 0.45 |
| 500510 | LARSEN & TOUBRO LTD. | 0.96 | 0.44 | 1.47 | 20.80 | 6.93 | 0.90 |
| 500520 | MAHINDRA & MAHINDRA LTD | 1.18 | 0.37 | 1.98 | 49.05 | 2.23 | 0.75 |
| 532500 | MARUTI SUZUKI INDIA LIMITED | 0.69 | 0.18 | 1.67 | -8.83 | 1.34 | 0.50 |
| 532555 | NTPC LTD. | 0.61 | 0.28 | 1.18 | -12.16 | 1.97 | 0.20 |
| 500312 | ONGC CORPN | 0.63 | 0.20 | 1.44 | 4.10 | 3.47 | 0.20 |
| 532712 | RELIANCE COMMUNICATIONS LTD. | 1.11 | 0.24 | 2.31 | -23.20 | 0.62 | 0.35 |
| 500325 | RELIANCE INDUSTRIES LTD. | 1.11 | 0.54 | 1.53 | -7.15 | 11.53 | 0.55 |
| 500390 | RELIANCE INFRASTRUCTURE LTD | 1.12 | 0.36 | 1.91 | -19.42 | 0.80 | 0.60 |
| 500112 | STATE BANK OF INDIA | 1.09 | 0.42 | 1.70 | 33.78 | 5.56 | 0.45 |
| 500900 | STERLITE INDUSTRIES. | 1.61 | 0.50 | 2.31 | -24.58 | 1.76 | 0.50 |
| 532540 | TATA CONSULTANCY SERVICES LIMITED | 0.82 | 0.27 | 1.59 | 56.68 | 4.10 | 0.30 |
| 500570 | TATA MOTORS LTD. | 1.52 | 0.43 | 2.36 | 87.18 | 2.69 | 0.65 |
| 500400 | TATA POWER CO. LTD. | 0.71 | 0.30 | 1.31 | -4.35 | 1.39 | 0.70 |
| 500470 | TATA STEEL LIMITED. | 1.56 | 0.52 | 2.20 | 1.53 | 2.40 | 0.70 |
| 507685 | WIPRO LTD. | 0.94 | 0.33 | 1.67 | 11.36 | 1.67 | 0.25 |
|
|
|
|
|
|
|
|
|
| SENSEX | 1.00 |
| 1.01 | 15.33 |
|
| |
|
| Beta = Co-variance(SENSEX, Stock)/ Variance(SENSEX) |